Hey there! My name is Jordan and I write about trading for the WOLF Financial newsletter. If you are looking for more trading tips and tricks I guarantee you’ll enjoy my content on 𝕏, @AceTheKidTA. Thanks for reading!
This service is for general informational and educational purposes only and is not intended to constitute legal, tax, accounting, or investment advice. These are my opinions and observations only. I am not a financial advisor.

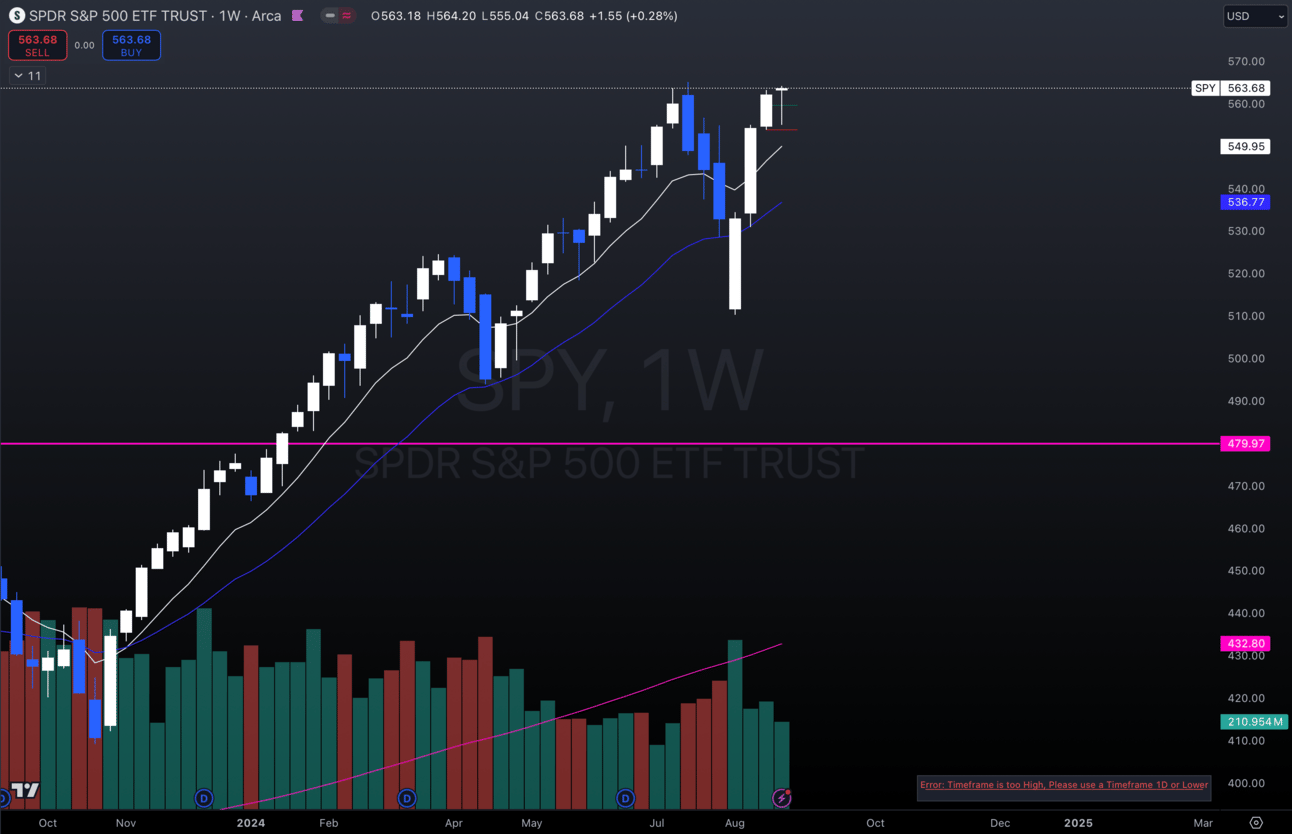
Here we are, back at all-time highs.
Everybody was so bearish at the lows, but like I said last week…
Always fade the short-term trend for the long-term trend.

$SPY Weekly
People get too euphoric during the short-term price action and end up getting a jab to the face and don’t know how to react.
Along with following the overall trend, you need to be aware of where we are trading in all time frames.
No matter whether you are a swing trader or a day trader, knowing the levels of interest on all time frames could be the deciding factor on whether you take a winning trade or a losing one.
Why Should I Check All Time Frames?
Being aware of the environment on different time frame charts allows you to be as prepared as possible for any moves.
Back when I was day trading more, I would ignore the daily charts and only focus on the 5 minutes just to get surprised by a huge bounce or sell-off from a level I didn’t even have charted.
I used to wonder how some of these guys nailed reversal bottoms/tops and then I started checking different time frames.
If I catch an intraday reversal 9 times out of 10, it’s from a daily level/fib/EMA and I know there is a good chance to get a reaction off of that area at least if not a full-blown reversal.
For example:

$SPY Daily
Yesterday on $SPY you can see the daily 9 EMA sits at about $557.20.
Opening up that day, I knew if we got a test of that area that it would be a good place to try longs since $SPY has been consolidating over the 9 EMA for the past week and a half and has gotten a reaction off of it in the past.
The low of the day ended up being $557.18.
If you had just bumped up your time frame, you could’ve pinpointed the spot that had the best probability for a reversal.
Whether you catch a full reversal or just a small scale is dependent on the price action that comes after testing said area.
I only recommend trying to catch these reversals when you are fading the short-term trend for the long-term trend.
I wouldn’t be trying to catch the bottom in a bear market is what I’m saying.
I hope this information helps you guys with your trading and maybe opens some eyes.
Thanks for reading.
-Jordan


