Hey there! My name is Nate and I write about trading for the WOLF Financial newsletter. If you are looking for more trading tips and tricks, I guarantee you’ll enjoy my content on 𝕏, @tradernatehere. Thanks for reading!
This service is for general informational and educational purposes only and is not intended to constitute legal, tax, accounting or investment advice. These are my opinions and observations only. I am not a financial advisor.
We are off to a great start to the year and many stocks are making new highs as money continues to pour into the markets.
How can markets continue to power higher from here?
And a better question, how can you trade it?
The secret might be found in sector rotation.
As we move through market cycles, different sectors perform better at different stages which can create a natural grind higher.
This also creates trading opportunities.
If you are early to identify the right sectors for the right part of the cycle, you can enter at relatively low levels and take maximum advantage of the run up that follows.
Let’s take a look at each part of the cycle and how different sectors have historically performed during each.
Expansion
When markets are expanding you will hear a lot of positive earnings news, often reports of low unemployment, and typically news of rising income levels.
Confidence is high and sectors like technology and consumer discretionary have historically done well during this part of the cycle.
This is where traders can be found at their most active.
Businesses are enjoying higher profits, which leads to investments in new projects, which drives employment and allows consumers to spend more.
These are the good times and profits are rising!
Peak
After a solid period of expansion, the cycle will find a top and markets will start to roll over.
At this peak is when you might see inflation starting to pick up along with unemployment numbers.
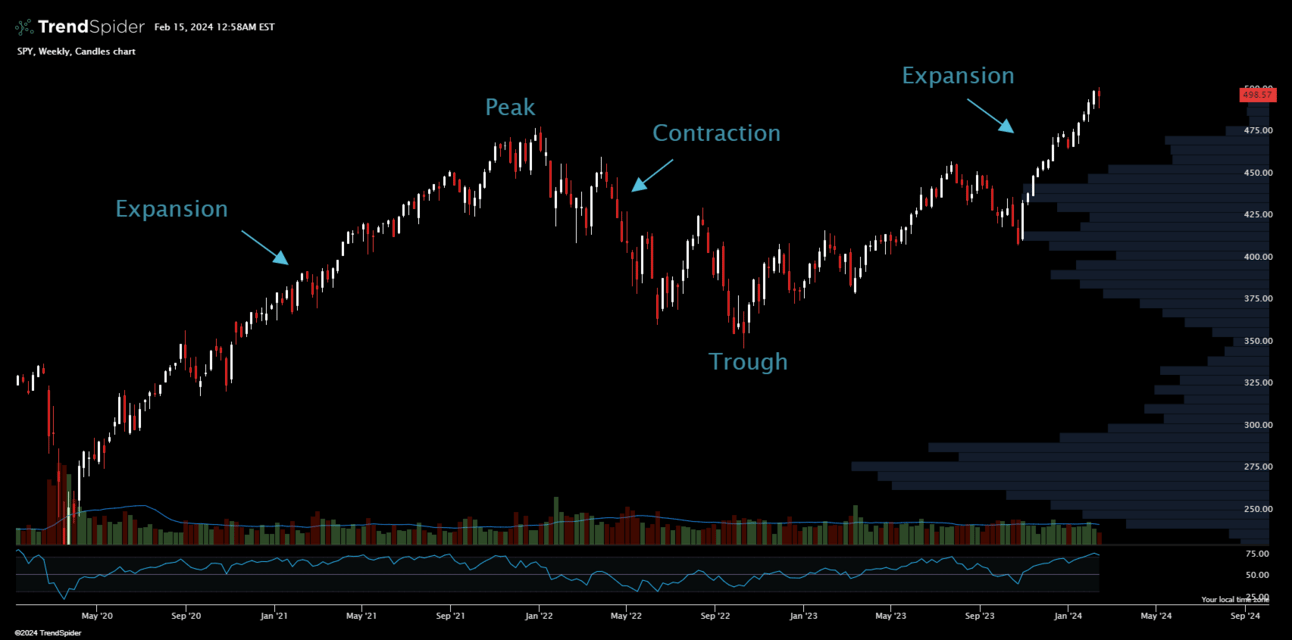
If this sounds familiar it is because that is exactly what markets were dealing with in 2022 when they pulled back after making all-time highs.

SPY weekly candles.
We saw the “Year of Efficiency” with heavy layoffs in tech and reductions in workforce following this peak.
Contraction
While it is nearly impossible to call the exact top when you are in the middle of it, you can definitely identify when the economy and markets are in a contraction period.
For the economy, it is characterized by a slowdown in growth, a rise in unemployment, and a decline in consumer spending.
While some are calling for a big reversal and markets to pull back dramatically, there are very few signs that align with what you would expect during economic contraction.
During this part of the cycle, consumer staples and utilities often do well as investors look to these sectors as a safe haven during markets draw downs.
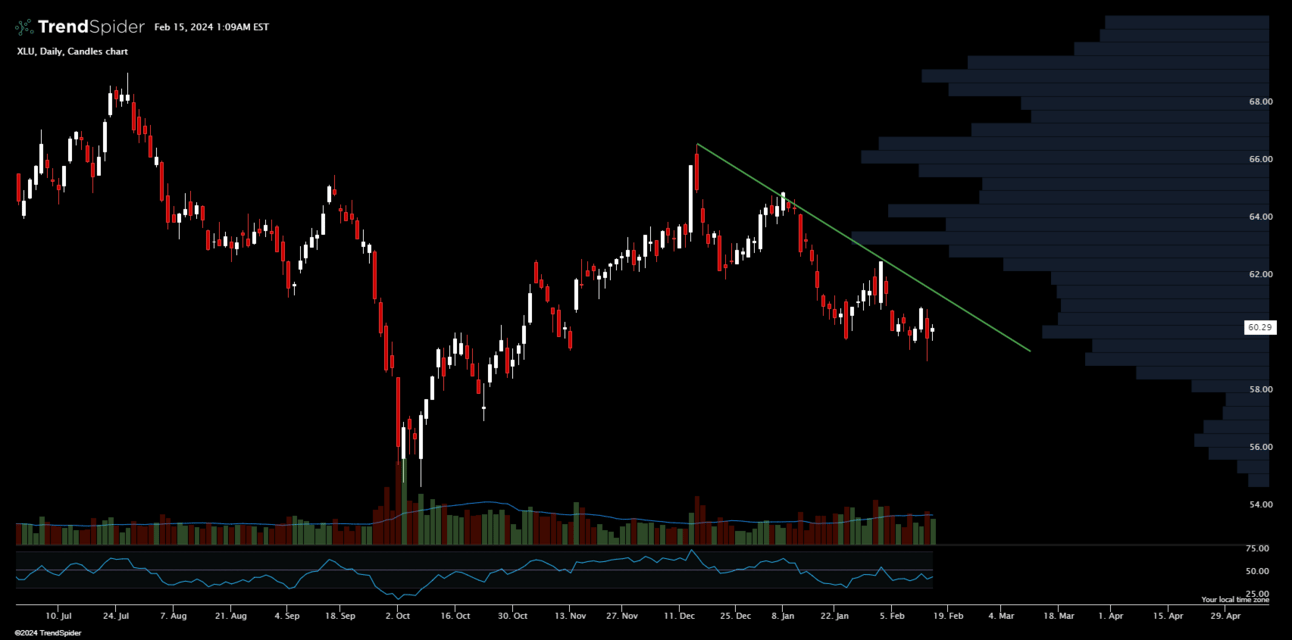
Currently utilities are in a downtrend, reflected in the chart for XLU.

XLU daily candles
This is not typical during the contraction phase, as investors generally enjoy the yield and perceived safety of these stocks.
If we start to see a reversal and break of trend for utilities, it could be a bad sign for the market overall.
Trough
The trough is the lowest point of the cycle.
This is where the stocks finally find their footing and while there are not looking overly healthy yet, there is a sense that a recovery is starting.
Traders that recognize this phase quickly are able to identify opportunities ahead of the next expansion period, setting up for potentially huge gains.
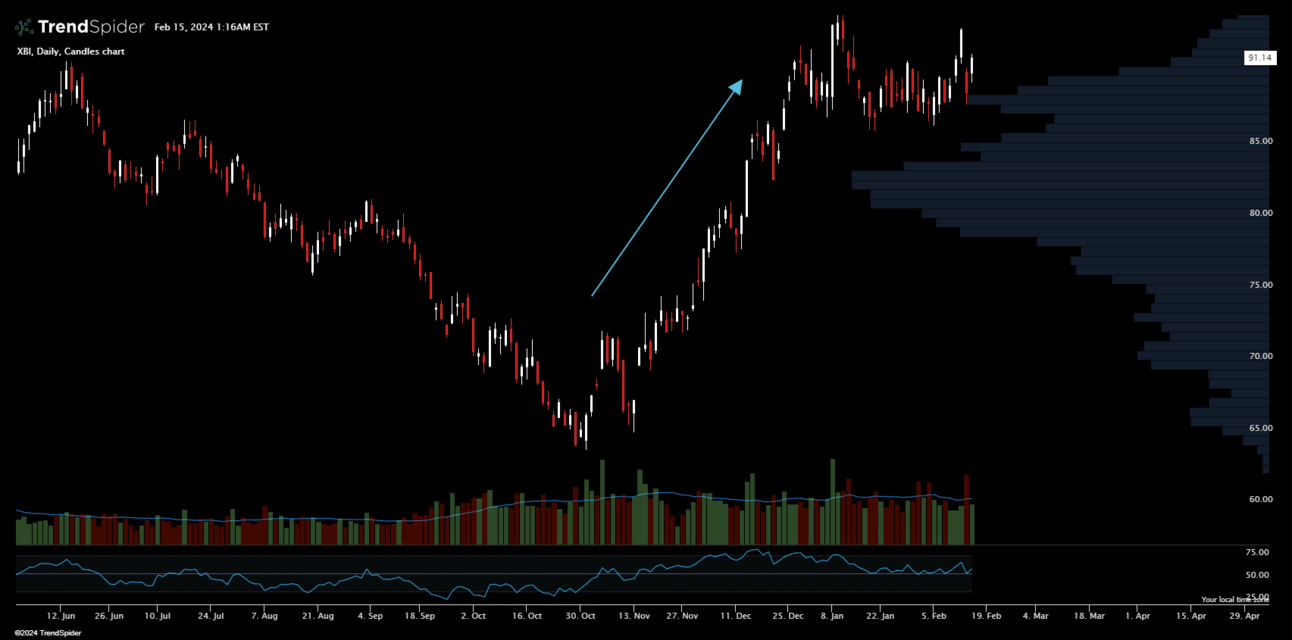
XBI recently experienced a low point as the biotech sector hit its trough in October 2023. Note the attempted retest of the lows.

As rate cuts became the topic of discussion, sectors like biotech started to see buyers stepping in, anticipating the benefits.
If traders were paying attention, they could have identified the reversal after the failed attempt at retesting the low and bought in near $70, enjoying the run up since.
At times sectors can also fall out of favor, so much so that they become underweighted and undervalued.
When this kind of opportunity is identified you will see money start to rotate into the laggards, pulling the sector up.
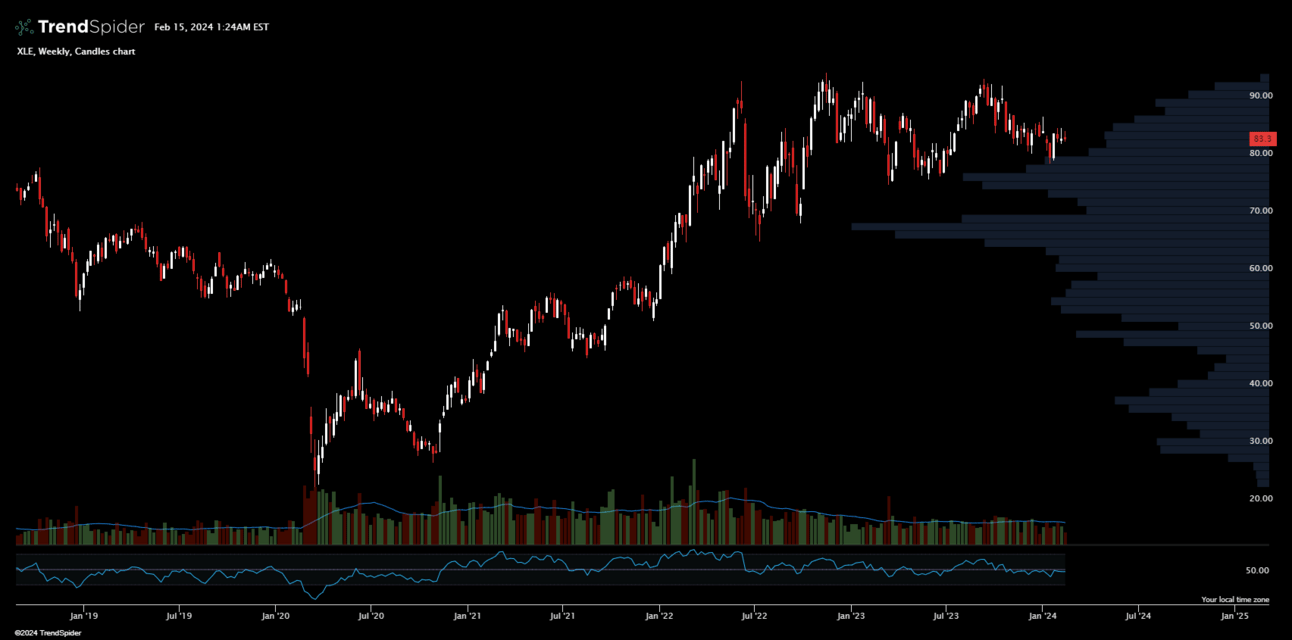
This is exactly what happened with the energy sector as XLE fell to low levels below $30 per share.
The chart for XLE shows the massive growth from $35 to above $80 since.
If you bought in early (like I did, cost basis $36!) you have enjoyed the ride.

XLE weekly candles
Paying attention to market cycles allows you to take action and rotate into different sectors.
Paying attention to leaders and laggards might also identify areas where a sector rotation would prove beneficial.
Remember to trade the charts in front of you, look for sector strength, and avoid trying to fight the trend.
Have a great week ahead!
-Nate
