Hey there! My name is Nate and I write for WOLF Financial. If you enjoy learning about trading, I guarantee you’ll also enjoy my newsletter A Trader’s Education, and more of my content on 𝕏 @tradernatehere. Thanks for reading!
This service is for general informational and educational purposes only and is not intended to constitute legal, tax, accounting or investment advice. These are my opinions and observations only. I am not a financial advisor.
I was telling WOLF about why I prefer to trade the charts instead of relying more on my decades of fundamental analysis education and experience.
Working with portfolio managers that took pride in fundamental analysis was eye opening.
You learn a lot working with brilliant investors managing billions.
The fund I was working for spoke at length about their due diligence and meetings with management teams.
I added to that knowledge by spending years at a Fortune 500 company as an analyst helping produce our quarterly numbers.
The big take away from both experiences was that there are far too many variables for the average person to be able to forecast reliably.
Honestly, I don’t know how anyone can try to predict the direction a stock is headed based on fundamentals alone.
This is precisely why I prefer technical analysis.
And why I prefer to talk patterns over balance sheets.
You can argue that news events will override any pattern and I would agree.
I would also say that news events ignore fundamentals.
A pattern on a chart is what it is. There is no hidden data in some footnote or buried in fine print.
There are no accounting tricks, lie detector tests, or lengthy reports to dig through.
And you can define your time frames much more clearly with a chart.
Compare that with trying to predict the timing of impacts to the stock price based on changes to business operations or accounting methods.
The simplicity of reading charts really is appealing.
This is especially true when we are facing a myriad of variables that impact the markets in significant ways.
Inflation, rate hikes, unemployment, war, trade restrictions, the list goes on and on.
The chart always has the same elements, and if you’re lucky, a familiar pattern or two.
With that, let’s get to this week’s pattern: the Bearish Expanding Triangle.

Unfortunately, there are a number of charts showing up with this pattern.
As a trader, it is important to identify these patterns early, allowing you to be prepared to take advantage when the opportunities pop up.
When identified early, the Bearish Expanding Triangle is a pattern that can be traded for big gains.
Let’s take a look at a few charts!
Breaking Down the Charts
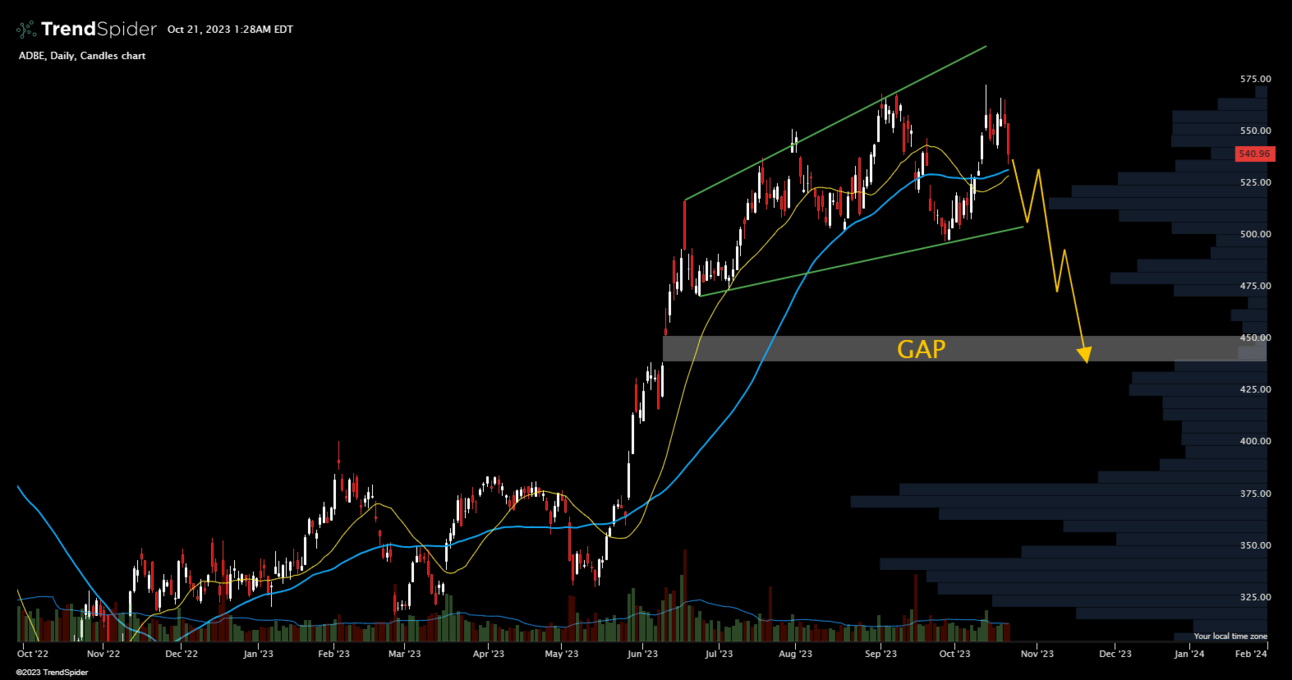
First up is ADBE, which made a nice climb from about $345 to nearly $575but could be setting up for a breakdown.
Notice the broadening of the triangle or wedge.

ADBE showing the Bearish Expanding Triangle pattern.
The Bearish Expanding Triangle tilts slightly to the upside and reflects buyers repeatedly exhausting attempts at a smooth continuation higher.
At first you are seeing higher highs and higher lows, but alarm bells should go off when the lower low forms.
When sellers step in with force, they are able to drive the price lower and lower but often there is some resistance.
This pattern of buyers pushing to new highs and sellers finding new lows repeats and forms the expanding triangle.
The stock will finally run out of buyers willing to attempt another climb and the bottom of the triangle breaks, giving way to steeper declines.
Taking a look back at ADBE, if shares drop below $505 it would break the lower bound and could see $475 quickly.
If that level fails to hold, there is a gap to fill all the way down to $440.
Keep an eye on ADBE.
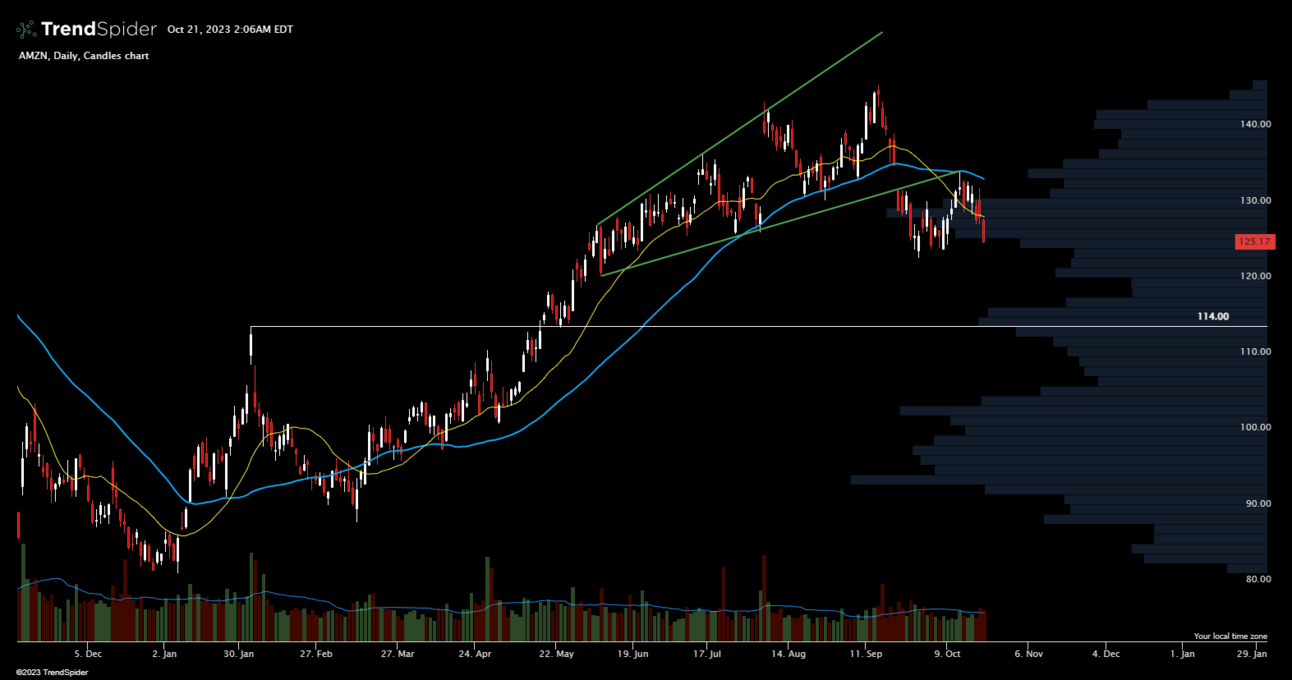
An example of the sellers already winning out can be found in the chart for AMZN.

More downside on the way for AMZN?
The expanding triangle for AMZN has been broken, the candles retested and rejected, and it looks to be headed lower from here.
Notice the dramatic break of the lower edge. This is exactly what you are looking for.
A timid break of any support or resistance levels can recover quickly.
A more severe break is less likely to change direction and a big gap down followed by more selling qualifies as a severe break.
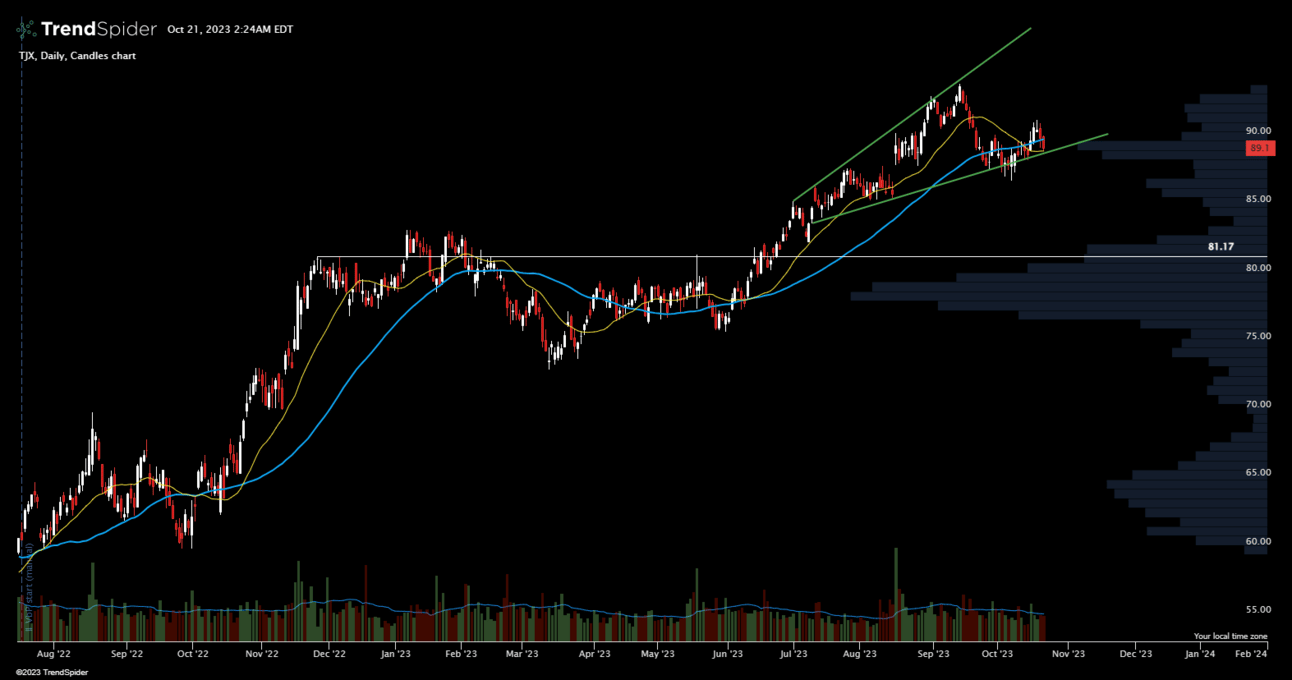
TJX is another name forming the Bearish Expanding Triangle and it is in a precarious spot.

TJX could see a steep decline.
Dipping just below the 50-day simple moving average, TJX is at the bottom of the triangle and a break could start a deeper decline.
There is some support near $87 but after that there isn’t much until $81 which is a 9% drop from Friday’s close.
As you can see from these examples, adding this pattern to your memory bank will make you a better equipped trader.
If you found this information helpful, consider sharing it with others so we can all trade wisely together.
Have a great week ahead!
-Nate