Hey there! My name is Nate and I write for WOLF Financial. If you enjoy learning about trading, I guarantee you’ll also enjoy my content on 𝕏 @tradernatehere. Thanks for reading!
This service is for general informational and educational purposes only and is not intended to constitute legal, tax, accounting or investment advice. These are my opinions and observations only. I am not a financial advisor.
Stocks are making new highs which is something I love to see.
You may find your portfolio at new highs as well while you wonder, “what now?”
Returns have been excellent, and you don’t want to give anything back.
So, what trades are available at these levels?
The charts will help with answers to that question.
Identifying patterns will give you clues about what to expect next and the earlier you can spot them on your charts, the more money you can make.
No pattern is guaranteed, but they can be very helpful when used correctly.
When you are trying to figure out whether or not a stock will press to new highs or begin to reverse after a strong run, chart patterns can be your best friend.
Let’s take a look at a few.
DOUBLE TOP

The double top is well known but often overlooked. I have seen a number of big names forming this exact pattern.
When the double top forms there is a chance for a downside trade, even in a bull market.
The trick is to identify the pattern early enough to get in and profit while also waiting long enough to take an informed trade.
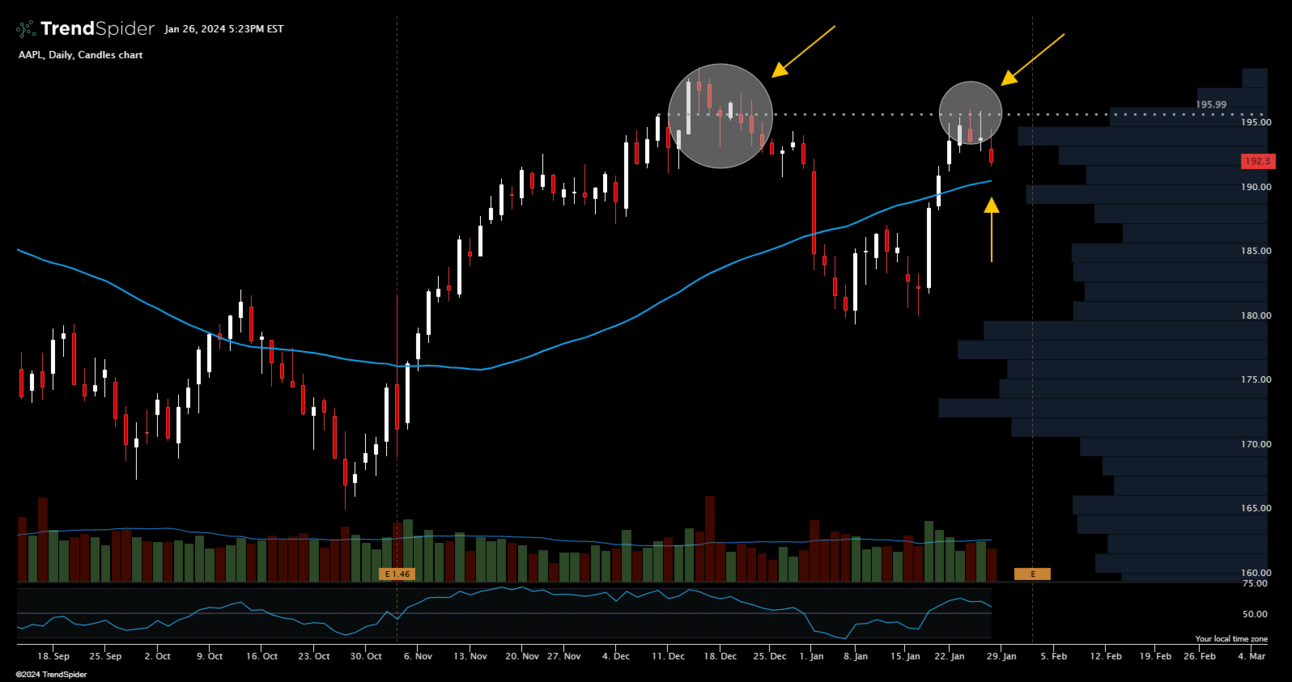
Take a look at AAPL. This chart has formed a clear double top, but is it time to short AAPL?

AAPL daily candles
Shares are still trading above the 50-day simple moving average (SMA) which is positive for now.
If shares do break below the 50-day SMA after forming this double top pattern it might be enough information to take a short position.
The pattern alone is not a reason to take the trade. However, if you couple it with other bearish signals and information it may add to your confidence that a move lower is on the way.
BULLISH PENNANT

After a stock has made new highs, it might experience a bit of sideways trading which can form the pattern of a pennant.
This consolidation period will ultimately give way to either a continuation higher or a break lower which can lead to lucrative trading for those that spot the breakout.
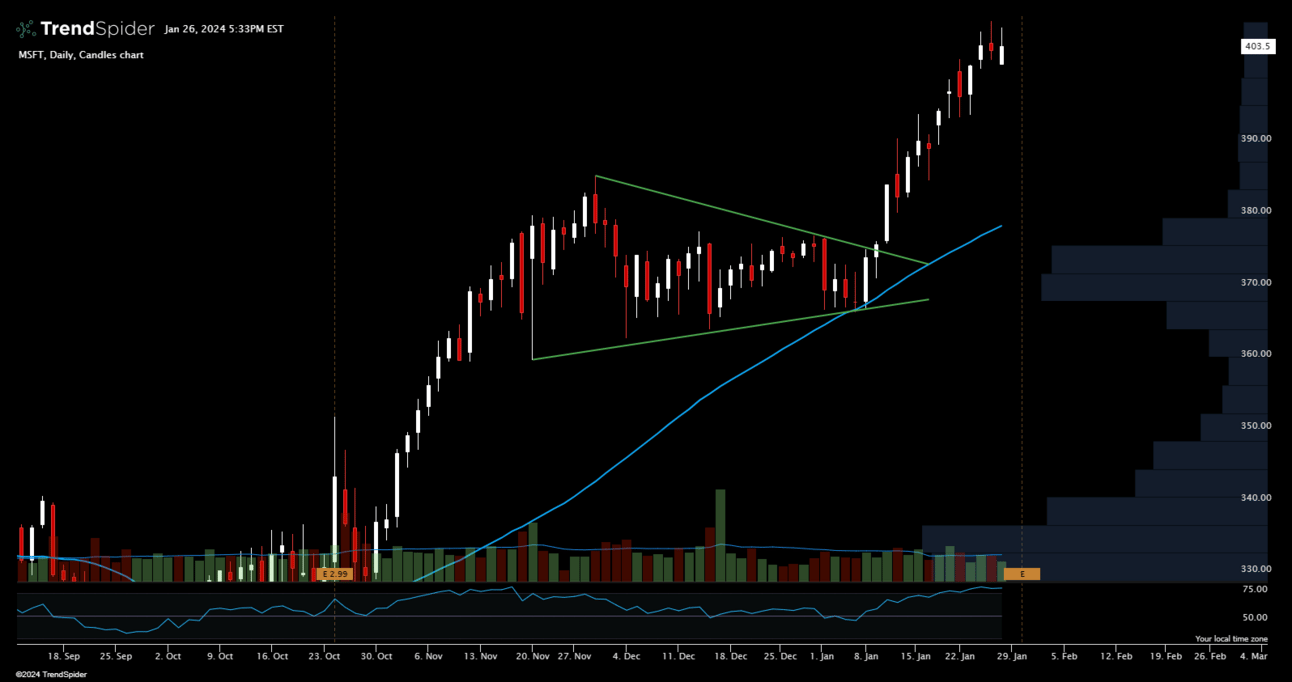
MSFT recently gave a great example of the Bullish Pennant Pattern followed by a strong move higher.

MSFT daily candles
Notice the 50-day SMA also provides support, allowing shares to use it as a springboard higher.
The Relative Strength Index (RSI) for Microsoft shares had also moved above 50, another data point signaling the likely move higher.
This was a great trade for those that got in before the big move.
BULLISH FLAG

Similar to the Pennant, the Bullish Flag Pattern allows for profit taking after a run to new highs only to see another move higher follow.
The consolidation is a little more orderly and forms a channel that needs to break.
You can trade the channel effectively if you are quick, but the bigger moves come on the breakout of the flag pattern for the continuation higher.
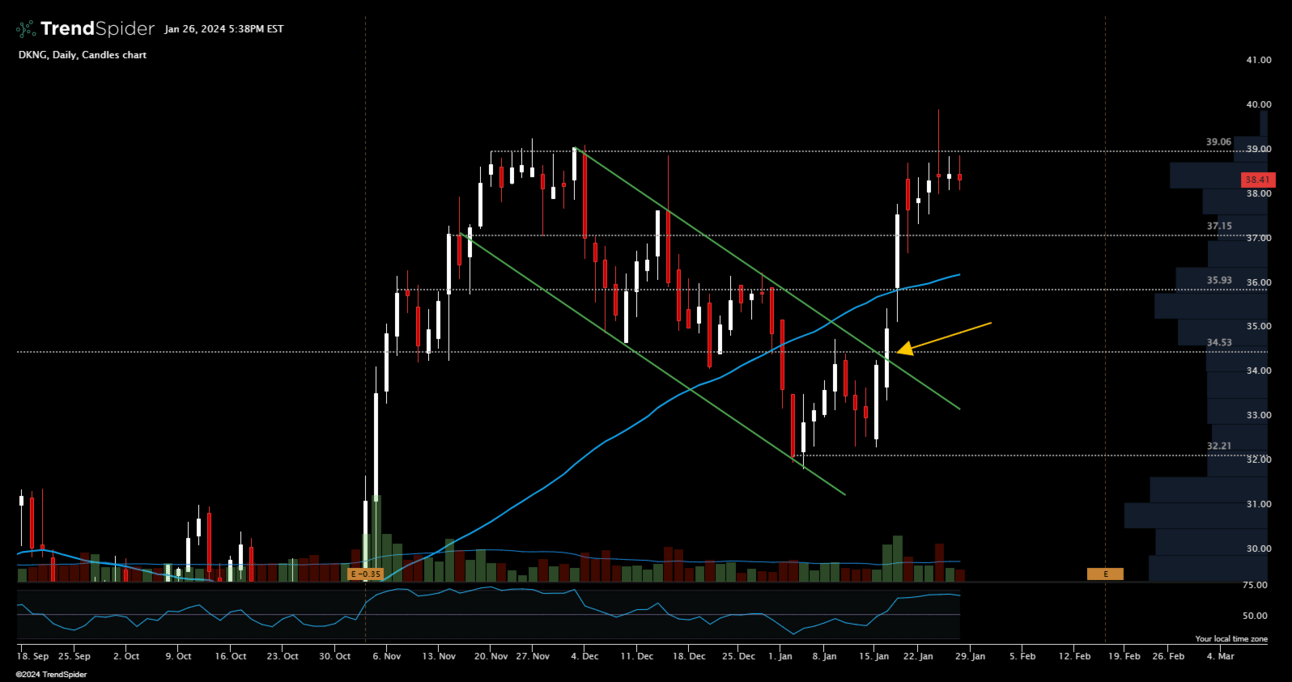
DKNG did exactly that to start the year and now is back near recent highs trying to move even higher.

DKNG daily candles
Keep an eye out for these patterns and take advantage of opportunities when they are presented.
The better you are at identifying trading set ups like these, the earlier you will be able to enter the trade, and your odds of success will only improve.
Have a great week of trading ahead and take some time to review your watchlist for these patterns!
-Nate
