Hey there! My name is Nate and I write for WOLF Financial. If you enjoy learning about trading, I guarantee you’ll also enjoy my newsletter A Trader’s Education, and more of my content on 𝕏 @tradernatehere. Thanks for reading!
This service is for general informational and educational purposes only and is not intended to constitute legal, tax, accounting or investment advice. These are my opinions and observations only. I am not a financial advisor.
It continues to be a stock picker’s market with some names outperforming mightily while others just drag down the indices.
There is no doubt that outperformance comes from selecting the right stocks.
Pick the right stock in the right sector and you could really find some momentum, especially if you get in at the right time.
That is why this week we are going to spend some time analyzing sector performance.
I will be sharing my ETF watchlist and walking through a few charts full of opportunity.
And I think you might be surprised at a couple of the set ups taking shape for end of the year trades.
To get a good sense of the landscape, I like to review this select group of ETFs.
By taking time to review each chart you will gain an understanding of what is going on across each major sector and where the momentum can be found.
This is something I recommend doing at least monthly.
The Sector ETF Watchlist
There is a core set of ETFs that I like to utilize when reviewing sectors.
This includes a number of ETFs that I review to get a broader understanding of how markets are acting in addition to the core sector ETFs.
First, the core sectors:
Communication Services (XLC): This sector includes companies that facilitate communications and offer related content and information. Think social media companies, gaming, media, and entertainment.
Consumer Discretionary (XLY): This sector covers companies that sell non-essential goods and services, such as automobiles, housing, and entertainment.
Consumer Staples (XLP): This sector includes companies that produce essential items like food, beverages, and household goods.
Energy (XLE): This sector comprises companies involved in the production and distribution of energy, including oil, gas, and renewable energy.
Financials (XLF): This sector includes banks, insurance companies, and real estate firms.
Health Care (XLV): This sector includes companies in the healthcare and biotechnology industries.
Industrials (XLI): This sector includes companies that manufacture and distribute goods, excluding food and drugs.
Materials (XLB): This sector includes companies that discover, develop, and process raw materials.
Real Estate (XLRE): This sector includes companies involved in real estate development management, and REITs.
Technology (XLK): This sector includes companies that create and distribute technological products and services.
Utilities (XLU): This sector includes companies that provide basic utilities like electricity and water.
I like to add a few more to the list:
Biotech (XBI): Invests in stocks of companies operating across health care, pharmaceuticals, biotechnology and life sciences sectors.
Regional Banks (KRE): Invests in stocks of companies operating across financials, banks, regional banks sectors.
Transportation (XTN): Invests in stocks of companies operating across industrials, transportation, air freight and logistics, ground transportation, cargo ground transportation, passenger ground transportation, rail transportation, marine transportation, passenger airlines, transportation infrastructure, airport services, highways and rail, marine ports and services sectors.
Semiconductors (SMH): Invests in stocks of companies operating across information technology, semiconductors and semiconductor equipment sectors.
This collection of fifteen ETFs can be reviewed to understand which sectors are leading, which are lagging, which are breaking out, and which are breaking down.
Once you’ve identified which sectors you are interested in, you can trade the ETF or you can dive into stocks within the sector, looking for the optimal trade.
We are seeing some interesting moves in a few of these ETFs.
To the charts!
Sectors Making a Move
I highly recommend reviewing multiple time frames as often as possible whether you are reviewing ETFs or stocks.
Zooming out to look at the weekly and monthly charts can provide added perspective.
Zooming in to the four-hour and one-hour charts can give insight on recent changes in short term trends.
The following set of charts happens to be all daily candles, but I find a lot of value in utilizing multiple time frames.
First up is the Communications Sector (XLC), which is trying to launch off of a volume shelf near $67.45.

Daily candles for XLC
MACD and RSI are both positive with room to move higher.
The 50-day simple moving average (SMA) is sliding under for support.
META, GOOG, and GOOGL make up roughly half of the ETF and will provide a lot of insight into the direction of the sector overall.
Targeting the July $69.22 high, if XLC can break through I like a continuation higher.
A rejection could see a return to the 50-day SMA.
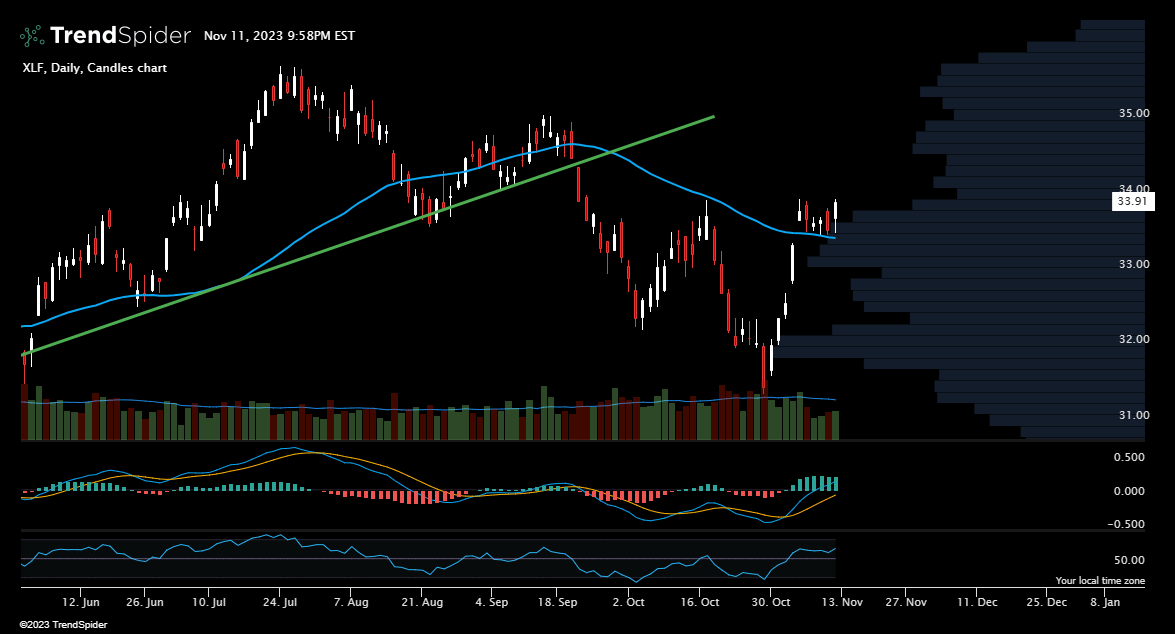
Next up are the financials and ticker XLF.

Daily candles for XLF
Another sector that has the 50-day SMA sliding in for support with a strong push higher to close the week.
The key level for XLF is only fifteen cents higher than Friday’s close.
Watch for either a rejection or breakthrough at $34 for an indication of where shares may be headed to close out the year.
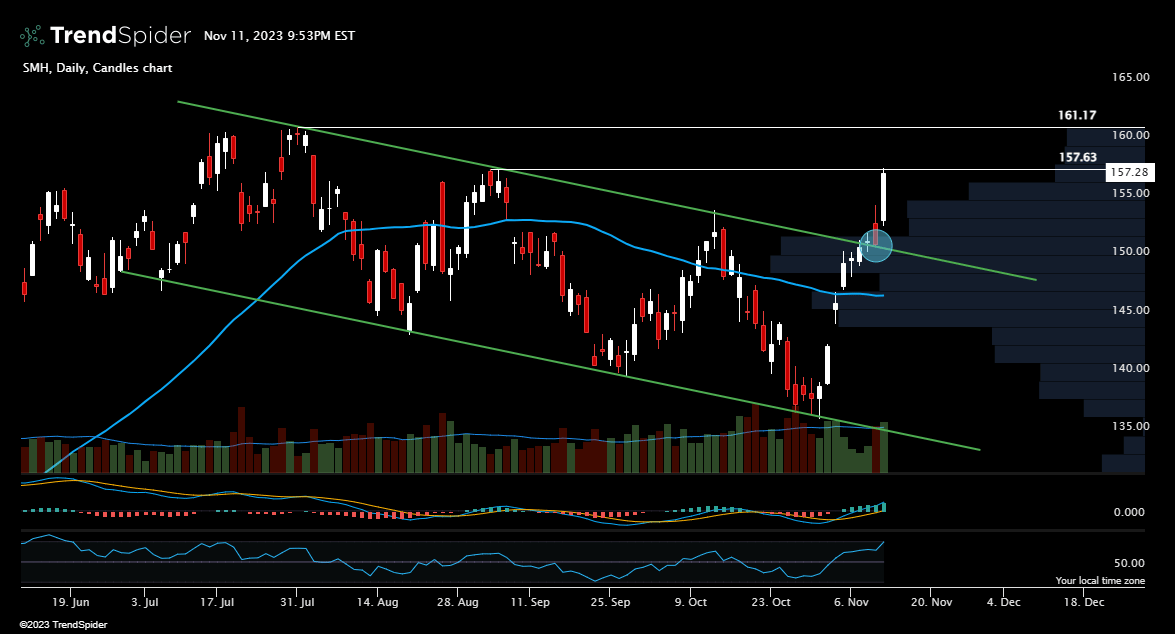
Another ETF moving higher is SMH, showing the strength for semiconductors is not over yet.

Daily candles for SMH
The downtrend has clearly broken with a higher high forming on the big move to close the week.
Back above the 50-day SMA, RSI and MACD are also indicating strength, and this sector looks to be waking up again.
The next level that needs to be broken through is $157.63 followed by $161.17, the July high.
After that it could be off to the races if the recent momentum continues with relatively high volume.
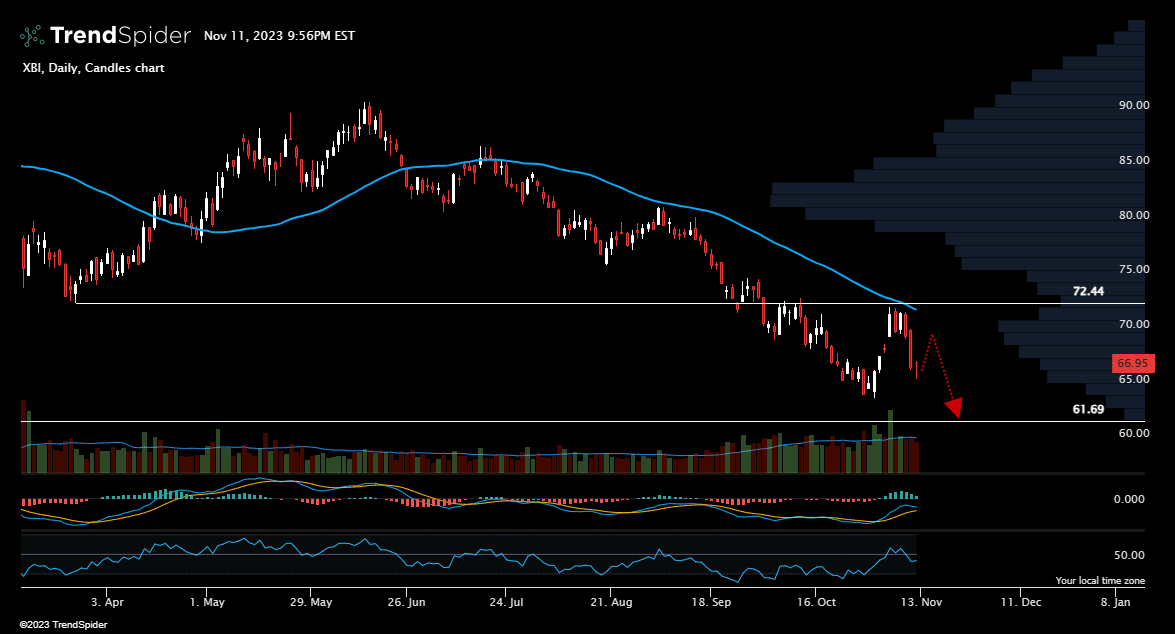
Last up, XBI is headed in the wrong direction.

Daily candles for XBI
After rejecting at a prior support level of $72.44, biotech looks to be heading back to recent lows and possibly lower.
The only level of support below comes in at $61.69 which is just $5 lower.
Not a great set up for those hoping XBI will find support.
And that is all for this week’s newsletter and sector review!
If you found this information helpful, consider sharing it with others and have a great week ahead!
-Nate