Hey there! My name is Jordan and I write about trading for the WOLF Financial newsletter. If you are looking for more trading tips and tricks I guarantee you’ll enjoy my content on 𝕏, @AceTheKidTA. Thanks for reading!
This service is for general informational and educational purposes only and is not intended to constitute legal, tax, accounting, or investment advice. These are my opinions and observations only. I am not a financial advisor.

The S&P 500 has pulled back 2.79% in the past 2 weeks of trading.
People have been asking me where I think this market will pull back to and bounce at for a retracement.
This is where I think Fibonacci levels are massively beneficial for someone like myself and especially newer traders.

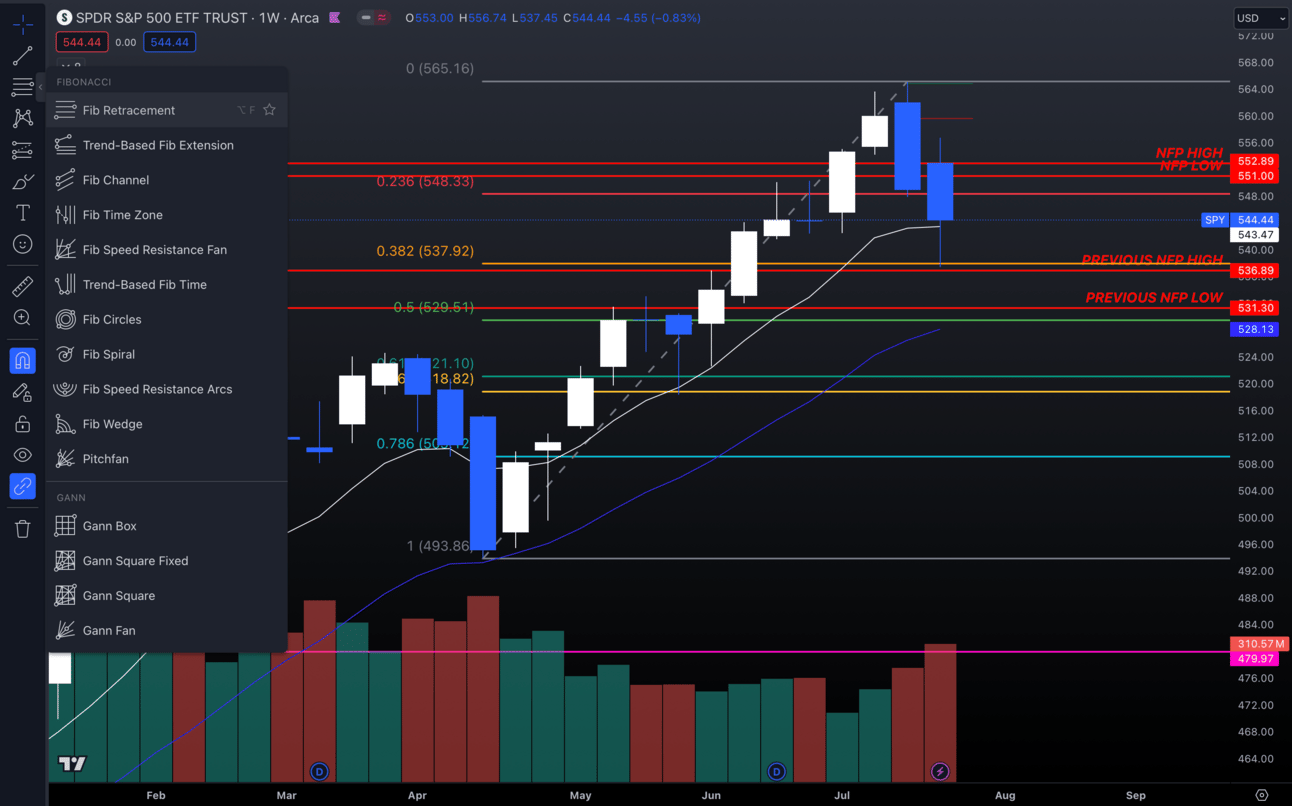
$SPY Weekly
You can see above I took the Fib Retracement tool and started at April lows and went to the recent all-time highs.
$SPY held up last week after testing my .382 Fib at $537.92. Instead of guessing where it would bounce, I took a known strategy that works well and pinpointed the latest rally.
I use Fibonacci Retracement levels daily and they are some of the most accurate levels you can get without having a ton of knowledge on finding support and resistance.
How To Use Fibonacci Retracement Levels?
The way I use Fibs is very simple.
I identify stocks with a strong trend that are starting to pull back from its highs on either a daily chart or any time frame higher.
I then pick the low and the high of the recent rally and see what my key levels are.

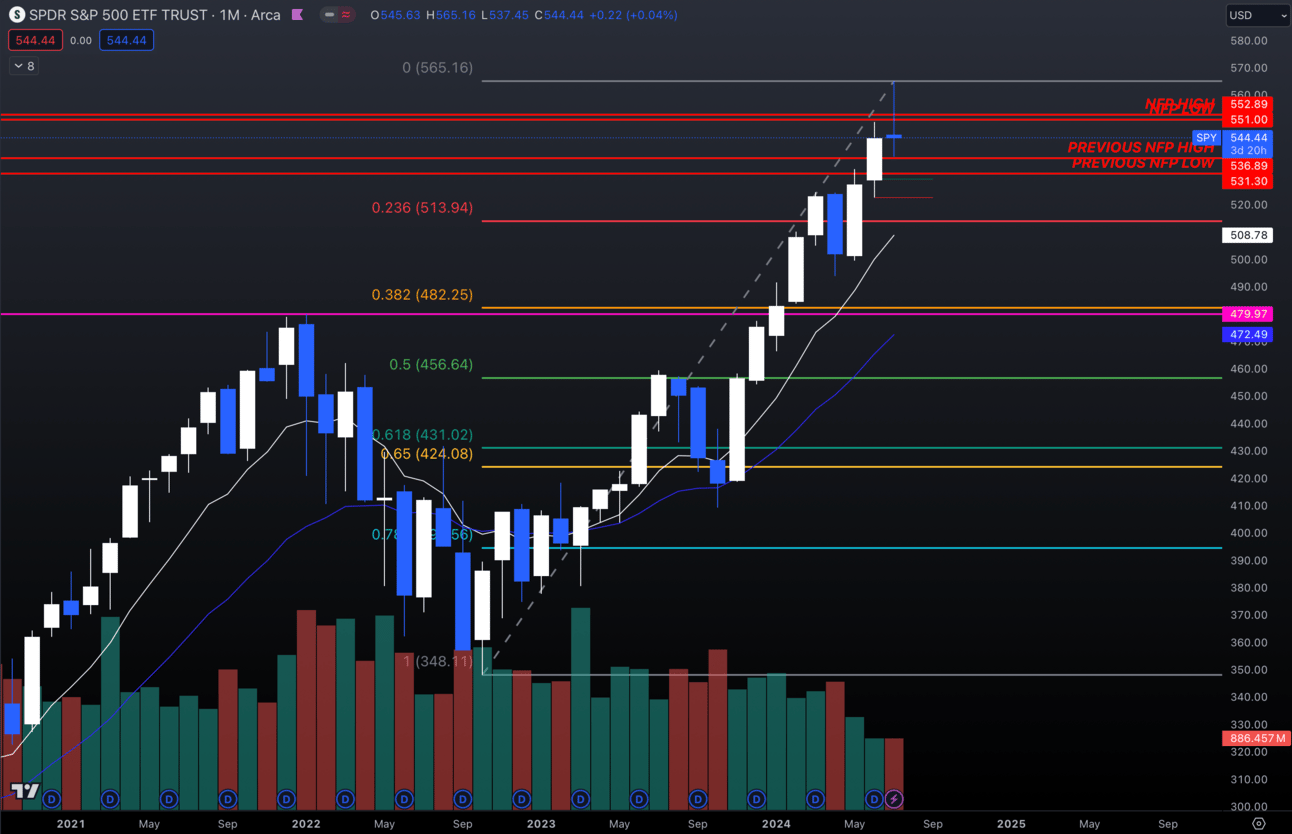
$SPY Monthly
Above you can see I went to a monthly chart started my Fib at the October lows and ran it to the recent highs $SPY has been pulling back from.
I now instantly have key levels that if we pull back to I can watch for high-volume moves and pinpoint opportunities.
The .382 Fib at $482.25 lines up very closely with previous all-time highs at $479.97 giving me 2 points of confluence for a reaction in that area.
In my opinion, keep it simple with Fibs. There is no reason to overcomplicate it.
Identify the trend, grab the low and high of the range you want, and you have your levels!
You can do this on smaller timeframes, but they won’t be nearly as accurate as using higher timeframes.
This can also very easily be used on a bearish trend. Instead of picking the low and then the high of your range first, you do the opposite.

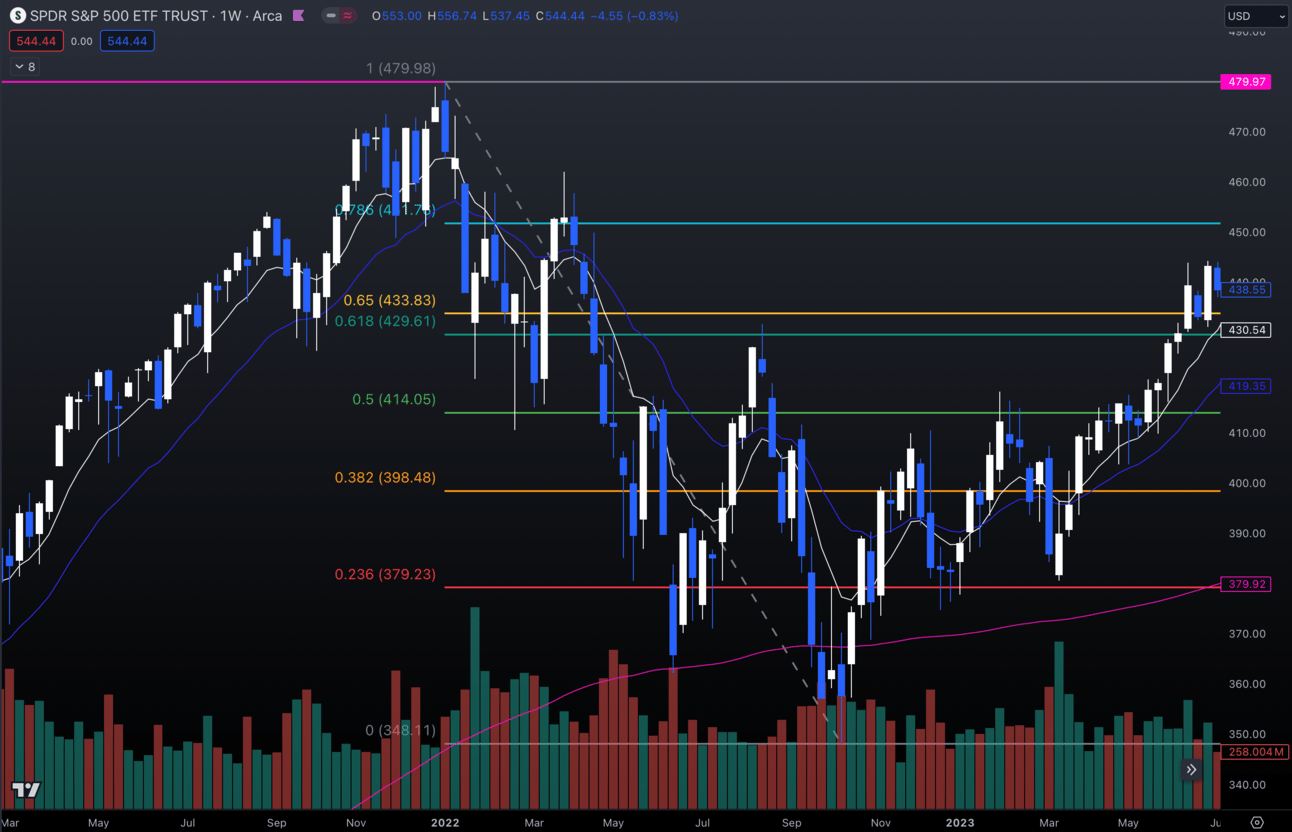
$SPY Weekly
Above I grabbed the high of the daily range and ran the fib to the recent lows to pinpoint retracement levels for possible bears to step in on the trend.
Very simple, you just reverse what was done originally.
I hope this helped you guys get a better understanding of Fibonacci and hopefully you can use this skill to further your trading!
Thanks for reading.
-Jordan

If you're seeking more investment insights, don't miss out on the EXCLUSIVE content on the WOLF Twitter page!
Have a blessed weekend!
Disclaimer: Wolf Financial does NOT offer financial advice. All content provided is strictly for informational purposes. Wolf Financial is not registered as an investment, legal, or tax advisor, nor as a broker/dealer. Please be aware that trading any stock or crypto-related asset carries inherent risks and may lead to substantial capital losses.

