Hey there! My name is Nate and I write for WOLF Financial. If you enjoy learning about trading, I guarantee you’ll also enjoy my content on 𝕏 @tradernatehere. Thanks for reading!
This service is for general informational and educational purposes only and is not intended to constitute legal, tax, accounting or investment advice. These are my opinions and observations only. I am not a financial advisor.
Zoom out, look at different time frames.
You hear this a lot, but what is really being said?
One of my favorite parts of technical analysis is the amount of data you can get from charts. It is seemingly endless.
One of the variations of data that you can play with is timeframes.
This is especially powerful for day trading. You always want to trade the right time frame.
So again, what does this mean exactly?
Let’s take a look at an example using Simple Moving Averages (SMAs) and the ticker for Microsoft, MSFT.
I like to look for candles respecting SMAs and using those touchpoints as entries for a continuation trade higher or lower.
To be effective, the candles have to show that they are bouncing off of the SMA line cleanly, otherwise the constant break of the line is not helpful.
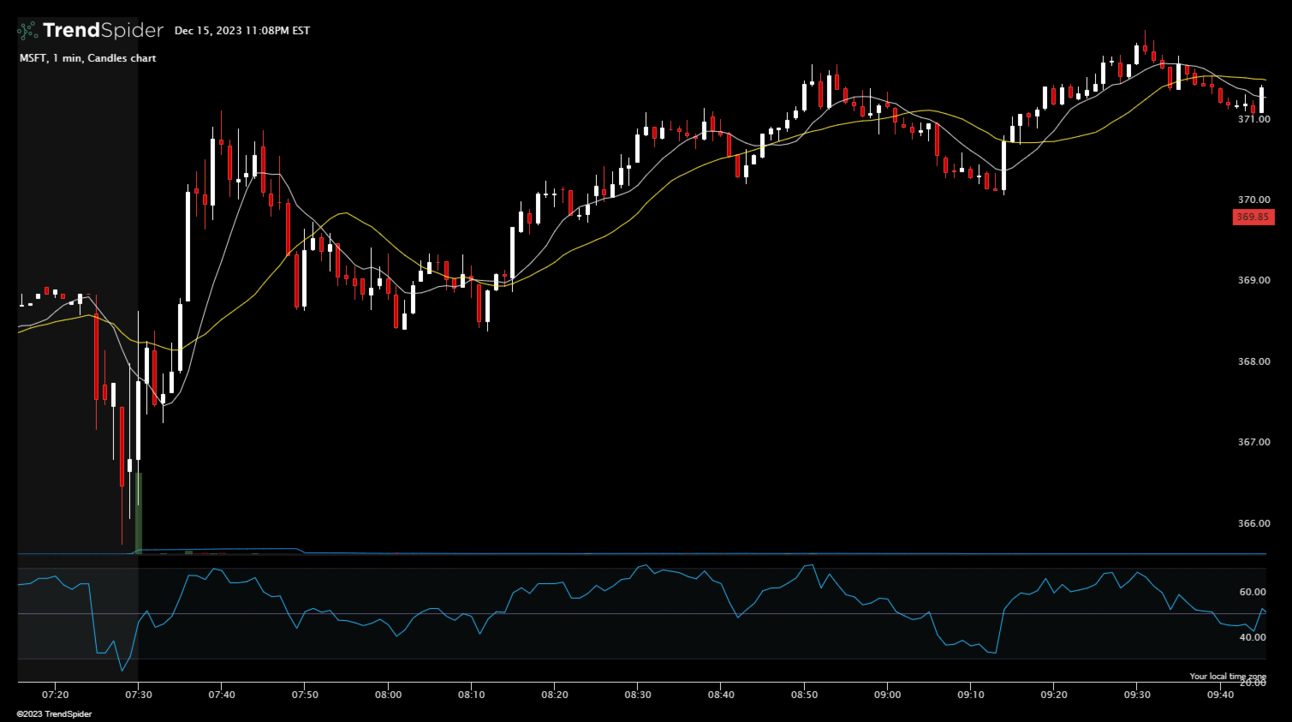
Using MSFT, starting with the 1-minute candles and the 9 and 20 SMAs you can see the candles show some signs of respecting the SMAs but it is clearly messy.

MSFT 1-minute candles
This is not helping you determine quality entries for day trading purposes.
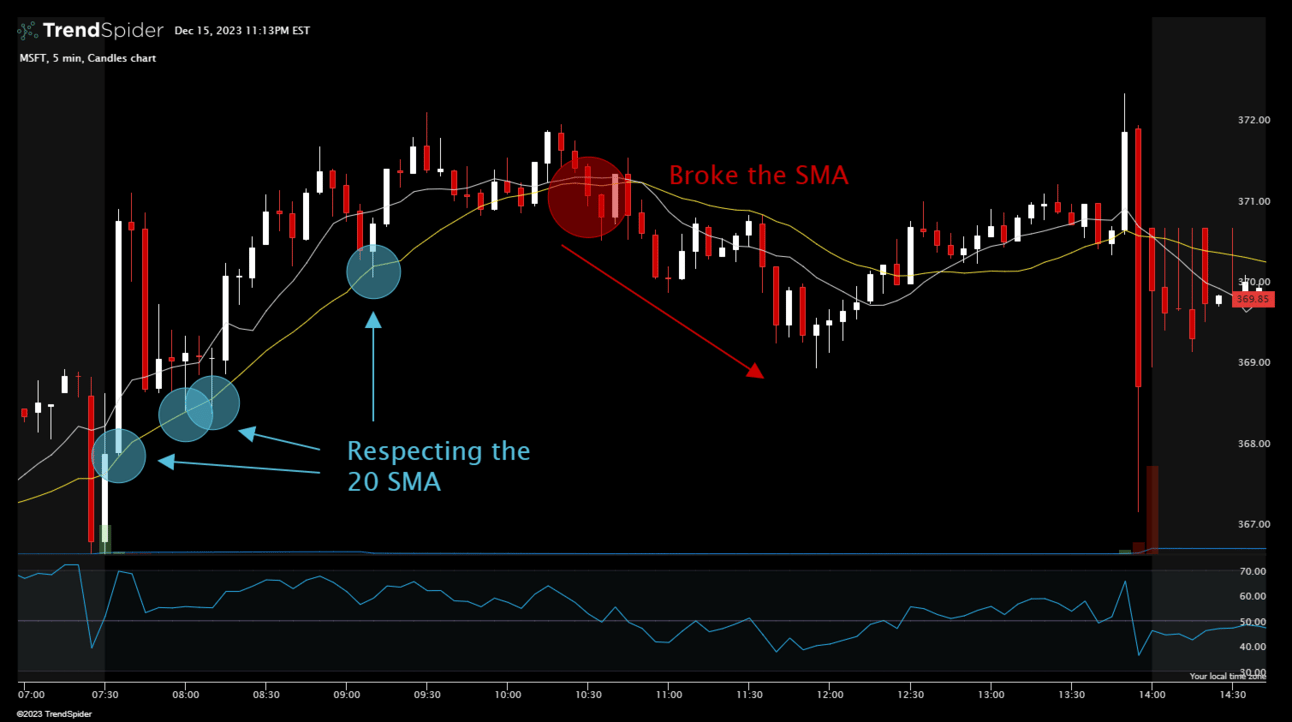
However, zooming out to the 5-minute candles shows there is clear respect of the 20 SMA on this time frame.
These touches are your entry points, clean and easy to identify.

MSFT 5-minute candles
After the five-minute candles bounce twice off of the 20 SMA, you could confidently take the third and fourth entries on the additional touchpoints.
Keep in mind, the longer the move, the shorter the expected additional legs higher. Expect to take tighter profits as the trade ages.
This concept can be extended to any timeframe.
If the five-minute timeframe was not showing clear support or resistance to the SMAs, try the ten-minute or fifteen-minute. Zoom out to hourly candles.
If you are looking at daily candles, take a look at what the candles are doing on a weekly or monthly basis.
How does this vary at key support and resistance levels?
Or you can go in the opposite direction and analyze the four-hour and one-hour candles relative to the daily candles.
The goal is to find the time frame that provides the most consistent and obvious data points.
Typically, this comes in the form of respecting support and resistance levels or SMAs (or EMAs if you prefer).
As always, you want to trade informed with the best data possible. Part of that is ensuring you review multiple timeframes to select the right entry and exit for each trade.
Have a great week of trading!
-Nate
