Hey there! My name is Nate Thomas and I write for WOLF Financial. If you enjoy learning about trading you might also enjoy my newsletter, A Trader’s Education, and more of my content on X @tradernatehere. Thanks for reading!
This service is for general informational and educational purposes only and is not intended to constitute legal, tax, accounting or investment advice. These are my opinions and observations only. I am not a financial advisor.
If you are enjoying the newsletter, enjoy sharing, and like rewards, we have great news!
Refer a friend to the WOLF Financial Newsletter and get our latest trade ideas. Refer 5 friends and get trade ideas every month!
Entries, exits, price targets, and stop loss levels. Everything included every month!
Last week we looked at Trading Double Tops and I pointed to LOW as a candidate to break down after forming this pattern.
Sure enough, LOW continued to drop back towards support near $204 just as the pattern suggested it would.
The week before we had VRTX as a stock that was poised to break out, and that was exactly what we got.
These patterns work well and in both directions. All you need to do is identify and trade them accordingly.
We will definitely continue to look at our favorite chart patterns, no doubt about it, but let’s go ahead and shift gears a bit.
This week we are talking about a popular and powerful way to trade.
I am talking about trading the open!
We are going to look at a simple yet highly effective strategy that you can begin using immediately.
Let’s start with a chart!

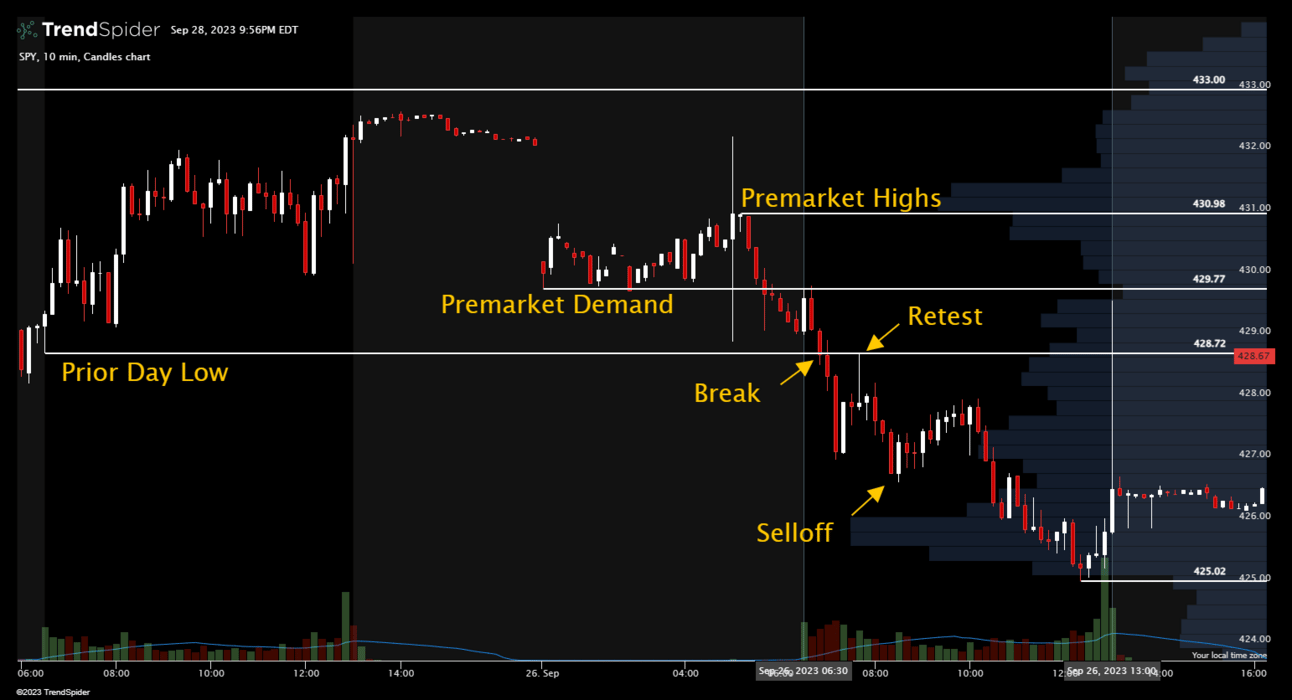
Using the prior day’s low, SPY provided a great set up for a short last Tuesday.
I like to use the 10-minute candles when day trading and trading the open.
You have to find which time frame works best for you, some like the 5-minute candles and others trade with the 1-minute candles.
The good news is this strategy works with whichever time frame it is that you prefer to trade.
If I am going to trade the open, I take the same approach every time.
First, I mark the prior day high and low as well as the premarket high and low.
I also then mark any clear levels of support or resistance from premarket trading as well as any obvious levels from the prior day.
In the chart of SPY above, Monday’s low of $428.72 proved to be the key level to trade against on Tuesday.
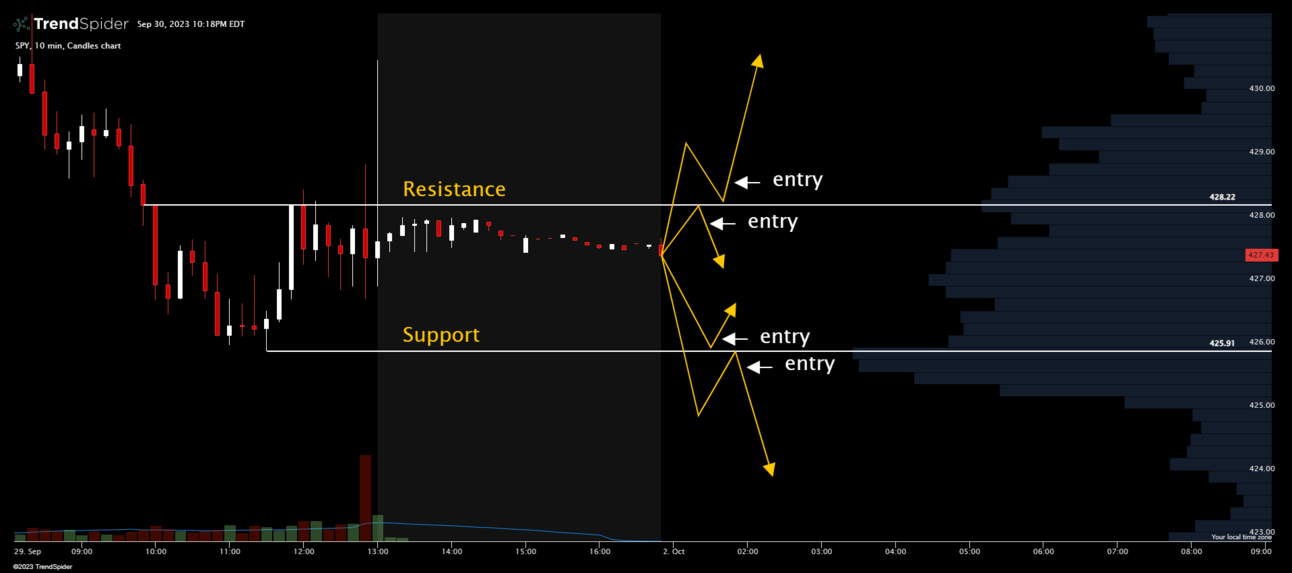
Before we get to the actual trade, it is important to understand the four scenarios that we are looking for.
These scenarios will play out around one of the key levels marked out on the chart (prior day high/low, premarket high/low, support/resistance).
Two of the set ups are bullish, trading for additional upside and two are bearish, allowing you to trade a move lower.
Altogether, they are what makes up the strategy for trading the open that is the subject of this week’s newsletter.
It is also a strategy that I personally use every week.
Trading Scenarios
Bullish - A break above resistance, retest, and continuation higher
Bullish - Support holding, trading the bounce and move higher
Bearish - A break below support, retest, and continuation lower
Bearish - Rejection at resistance and drop lower
That’s it. These are the only set ups you are looking for.

Four set ups to look for when trading the open.
What happens if they don’t show up? You don’t make a trade.
It really is that simple.
The good news is that one of these four scenarios play out often and provide a lot of opportunities for trading the first hour or two of the day.
Now take a look at the original chart for SPY again. Did you notice which set up was traded Tuesday?

Zooming in on the 10-minute candles for the downside trade last Tuesday.
If you said scenario 3 you are correct!
Let’s break it down.
First, immediately after the open there is a quick test of the premarket demand level. This is actually a decent entry for a short position.
That said, it occurred within 15 minutes of the open and if you missed it you don’t want to jump into the trade late.
The real set up comes when the prior day’s low was broken through and then retested.
The retest was quick, and the rejection signaled the high probability that shares would be under pressure.
This retest is exactly where you want to take a short position.
Once you are in the trade, use the same level as a stop loss and you are set.
Sure enough, selling continued and short positions did very well.
Had buyers stepped in, the stop loss kicks in and you’re out of the trade with minimal damage done.
Effective, Powerful, and Popular
The strategies that I appreciate the most are those that are both simple and effective.
It is up to you to maintain consistency.
Keep in mind, any strategy is intended to put the odds in your favor, but no strategy is a guarantee of anything.
I have found this strategy to be one that I can utilize nearly every day and with any ticker.
As another quick example, let’s take a look at Wednesday of this past week.
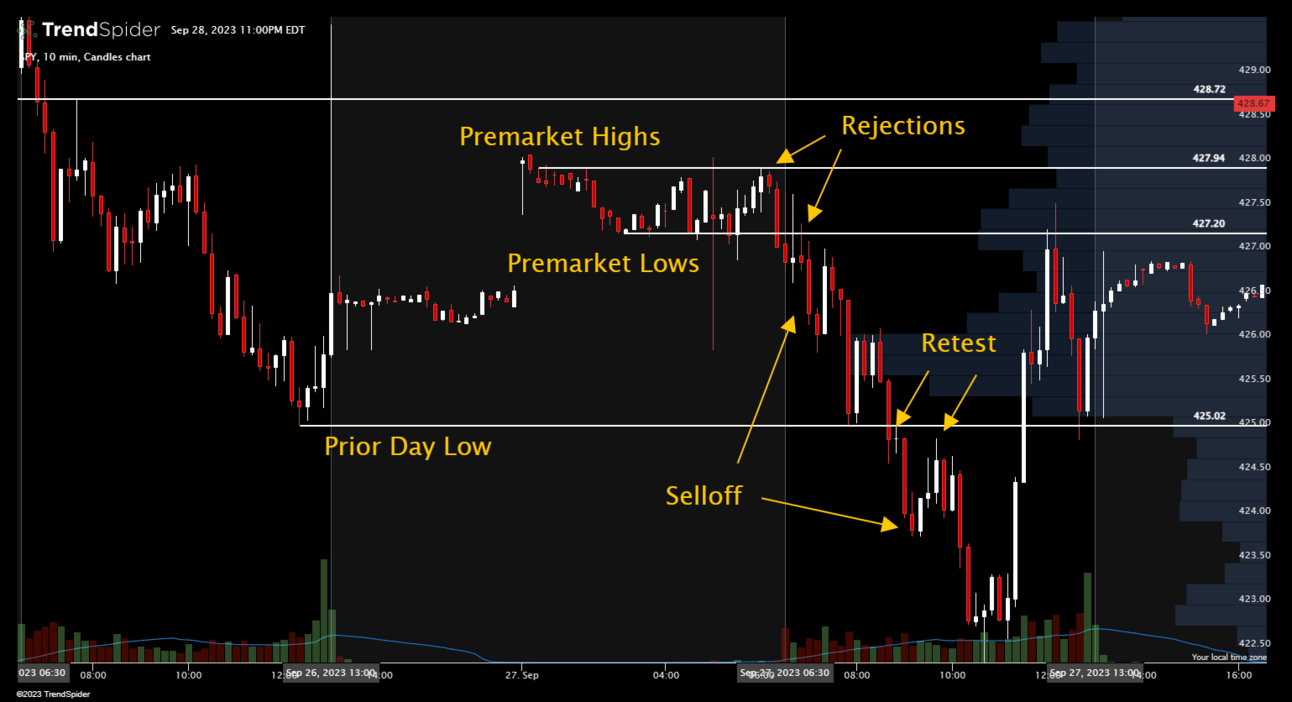
We are still using the same SPY 10-minute chart but now focused on the Tuesday low and Wednesday premarket levels to trade around.

During the premarket, a tight range formed with a clear high and low which were both marked out in addition to the prior day’s low.
At the open, shares quickly dropped from the premarket highs to below the premarket lows, but then paused.
After breaking below support, SPY then retested this premarket low level of $427.20 and rejected.
This rejection was the ideal spot to take a short position as shares sold off.
Had you continued to trade through the day Wednesday you would have also been treated to another great set up with shares breaking below the Tuesday low.
This level was quickly retested only to find further rejection and more selling.
The opportunities really are endless when you know what to look for.
Have a great week ahead and thanks again for reading!
-Nate