Hey there! My name is Nate and I write about trading for the WOLF Financial newsletter. If you are looking for more trading tips and tricks, I guarantee you’ll enjoy my content on 𝕏, @tradernatehere. Thanks for reading!
This service is for general informational and educational purposes only and is not intended to constitute legal, tax, accounting or investment advice. These are my opinions and observations only. I am not a financial advisor.
Identify the reversal point and you can both make a lot of money as well as save it.
Understanding which patterns to look for is key.
Gaining insight into market sentiment is what reading charts is about and this week we are going to take a look at an important candle.
This single candle can provide a ton of information and is one I always keep an eye out for.
I am talking about the Doji.
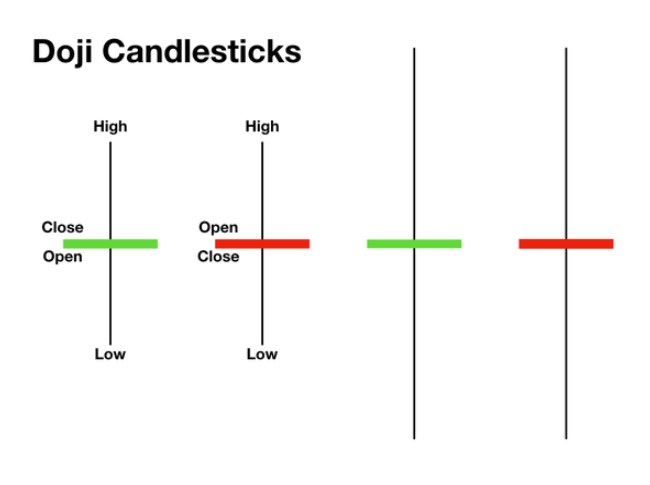
A Doji candle is a significant candlestick pattern in technical analysis and has easily identifiable characteristics.
I look for them in all time frames.
First, the opening and closing prices are virtually the same or have minimal distance between them relative to the overall price action for the candle. This results in a very small to non-existent body of the candle.
The shadows, or wicks, or tails (the lines extending from the body) can vary in length.
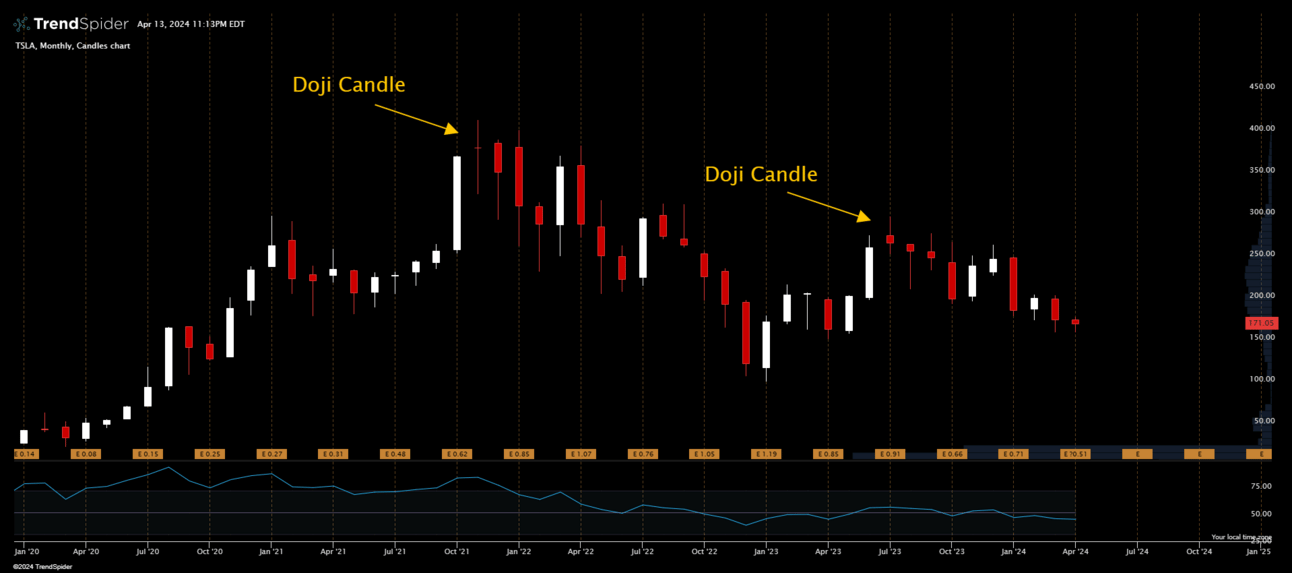
Here’s an example of two different Doji candles on the TSLA monthly timeframe.

TSLA monthly candles
In November 2021, the first Doji candle showed up after an incredible run and a really strong October. It was a signal worth paying attention to.
The following month was red which was the confirmation TSLA bears were looking for.
Notice the selling that took place afterwards. The indecision by the market at the price levels reached in November was not welcomed.
A second Doji candle showed up in July 2023 after a nice bounce for TSLA. This monthly candle had a wider body to it and might also be referred to as a “spinning top.”
In both cases, the candle represents uncertainty. The second instance was also followed by a red candle.
TSLA again saw significant selling for several more months.
The Doji represents indecision in the market. Neither the buyers nor the sellers could gain control during the time period, resulting in a standoff.
While this is interesting information, you should be looking for more.
Doji candles are most useful when identified in conjunction with other technical analysis tools.
They are often seen at the bottom and top of trends, signaling a potential reversal. However, a single Doji candle isn't a reliable indicator of a trend change.
It's best to look for confirmation on the following candle or from other indicators.
In the TSLA example, both Doji candles were followed by a red month which was a clear signal to take a short trade.

How to Use Doji Candles as a Trader
1. Spotting Reversals
A Doji at the peak of an uptrend or the bottom of a downtrend can signal a potential reversal.
If you see a Doji after a significant uptrend, it might indicate that the buyers are losing steam and a bearish reversal could be on the horizon.
Conversely, a Doji after a significant downtrend could suggest that the sellers are running out of momentum and a bullish reversal might be coming.
2. Identifying Market Indecision
Doji candles can help identify periods of market indecision. A Doji during a period of consolidation might suggest that the market is still deciding which direction to go.
3. Setting Stop Losses
Doji candles can also be useful for setting stop losses.
If you enter a trade based on a Doji signal, you might set your stop loss at the high or low of the Doji candle (depending on the direction of your trade).
Doji candles are a powerful tool in a trader's arsenal, providing insights into potential market reversals and periods of indecision.
However, they should not be used in isolation. Always confirm signals with other technical analysis tools and be aware of the overall market context.
Remember, successful trading isn't just about recognizing patterns; it's about understanding what these patterns signify in the broader market picture.
Have a great week of trading ahead!
-Nate
